


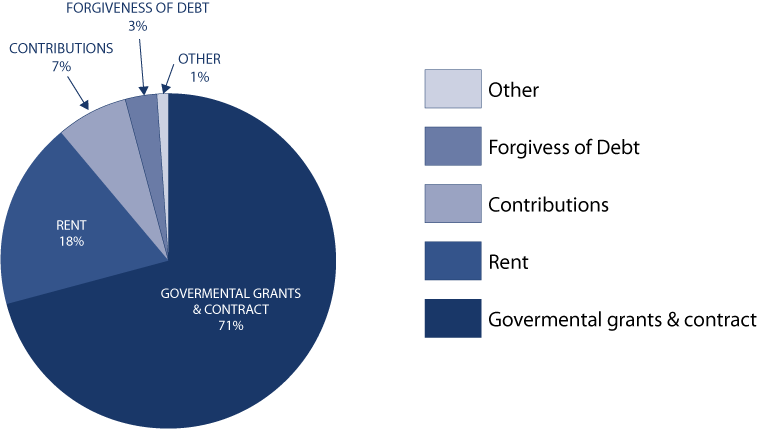
REVENUES
The following graph represents public support and revenues of the Organization for the year:
Total public support and revenue for the year ended June 30, 2017 was $3,480,168. This represents an increase of $304,751
Components of public support and revenue changed as follows:
| 2017 | 2016 | Increase/Decrease | |
|---|---|---|---|
| Governmental grants and contracts | 2,465,725 | 2,283,032 | 182,693 |
| Rent | 619,336 | 600,522 | 18,814 |
| Forgiveness of debt | 119,930 | 119,930 | |
| Contributions | 232,886 | 161,536 | 71,350 |
| Other | 42,291 | 10,397 | 31,894 |
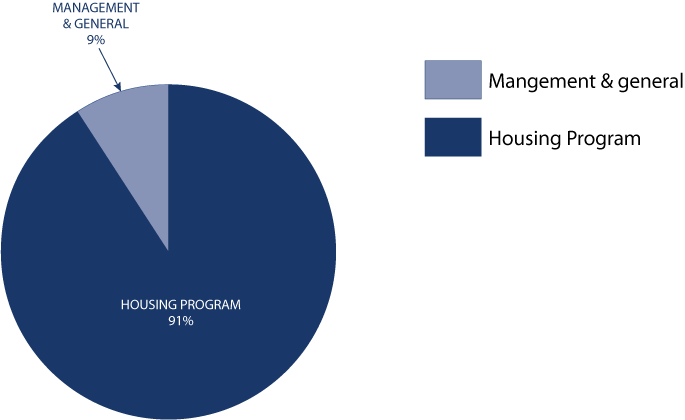
EXPENSES
The following graph presents expenses of the Organization before impairment loss for the year:
Total expenses for the year ended June 30, 2017 were $3,661,285. This represents an increase of $328,844 when compared with the prior year.
Components of expenses changed as follows:
| 2017 | 2016 | Increase/Decrease | |
|---|---|---|---|
| Housing program | 3,348,617 | 3,069,588 | 279,029 |
| Management & general | 312,668 | 262,853 | 49,815 |
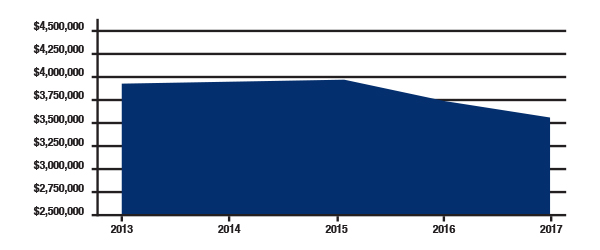
NET ASSESTS
The following graph illustrates actual net assets of the Organization for the last five (5) years:
Total net assets at June 30, 2017 were $3,600,569. This represents a decrease of $176,885 over 2016.
Components of net assets are as follows:
| Unrestricted | $3,568,345 |
|---|---|
| Temporarily Restricted | $32,224 |
| Total | $3,600,569 |
2004 – 2005 Annual Report
2006 – 2007 Annual Report

2009 – 2010 Annual Report
BHS Newsletter Fall 2012
2011-2012 Annual Report


 The mission of Broward Housing Solutions®, founded as a 501(c)(3) in 1993, is to provide quality, permanent and affordable housing opportunities to meet the needs of lower income or homeless
persons with disabilities who also have a mental illness.
The mission of Broward Housing Solutions®, founded as a 501(c)(3) in 1993, is to provide quality, permanent and affordable housing opportunities to meet the needs of lower income or homeless
persons with disabilities who also have a mental illness.