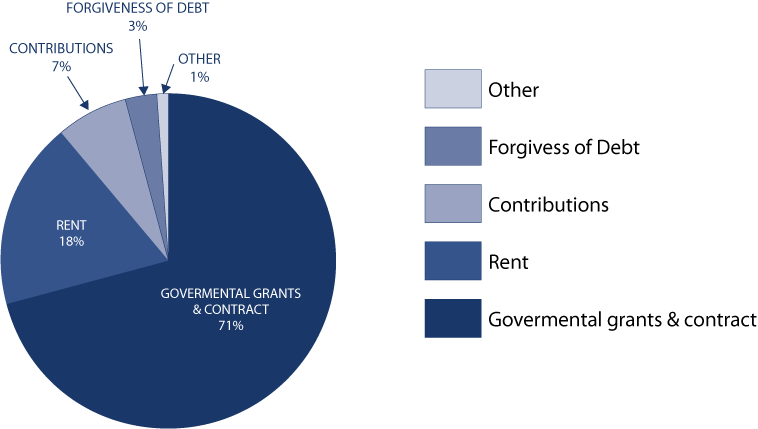
The following graph represents public support and revenues of the Organization for the year:
Total public support and revenue for the year ended June 30, 2017 was $3,480,168. This represents an increase of $304,751
Components of public support and revenue changed as follows:
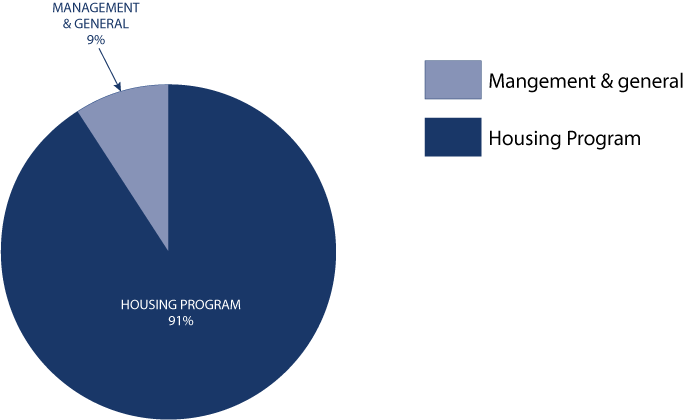
The following graph presents expenses of the Organization before impairment loss for the year:
Total expenses for the year ended June 30, 2017 were $3,661,285. This represents an increase of $328,844 when compared with the prior year.
Components of expenses changed as follows:
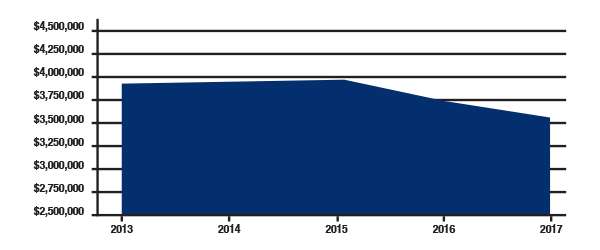
The following graph illustrates actual net assets of the Organization for the last five (5) years:
Total net assets at June 30, 2017 were $3,600,569. This represents a decrease of $176,885 over 2016.
Components of net assets are as follows: